


People's Choice
People's Choice
Award winner
Award winner
Visualizing Empathy: A VR Dashboard for SEL Evaluation
Visualizing Empathy: A VR Dashboard for SEL Evaluation
Visualizing Empathy: A VR Dashboard for SEL Evaluation
We designed a first-of-its-kind VR-prototyped dashboard using Meta Quest 3 and ShapesXR for SETH Labs, turning emotional gameplay data into meaningful insights for educators. Aligned with the CASEL framework, the dashboard helps teachers track empathy, spot Social Emotional Learning (SEL) growth patterns, and take action, all inside an immersive VR space.
We designed a first-of-its-kind VR-prototyped dashboard using Meta Quest 3 and ShapesXR for SETH Labs, turning emotional gameplay data into meaningful insights for educators. Aligned with the CASEL framework, the dashboard helps teachers track empathy, spot Social Emotional Learning (SEL) growth patterns, and take action, all inside an immersive VR space.


In collaboration with
Defining Product Vision
Defining Product Vision
Defining Product Vision
Challenge
Challenge
Challenge
SEL (Social Emotional Learning) is foundational for empathy, resilience, and healthy relationships, but for most educators, it remains intangible, a hazy outcome assessed through generic surveys or static PDF reports. Our client’s VR empathy game did a brilliant job helping middle schoolers develop these skills, but teachers and counselors had no way to see how or when students were actually growing.
How might we help educators better understand and evaluate middle school students’ social-emotional skills in a more engaging and meaningful way?
Why It Matters
Why It Matters
Why It Matters
SEL is foundational to how children build empathy, self-awareness, and emotional resilience, but it’s often taught like a checkbox activity.
We wanted to reimagine SEL as an experience, not a task, something that educators could see, feel, and interact with in real time.
SEL is foundational to how children build empathy, self-awareness, and emotional resilience, but it’s often taught like a checkbox activity.
We wanted to reimagine SEL as an experience, not a task, something that educators could see, feel, and interact with in real time.
SEL is foundational to how children build empathy, self-awareness, and emotional resilience, but it’s often taught like a checkbox activity.
We wanted to reimagine SEL as an experience, not a task, something that educators could see, feel, and interact with in real time.
User Research
User Research
User Research
Understanding the User & Research
To uncover what educators and parents really needed, I led a research phase anchored by 21 in-depth interviews with teachers, counselors, and parents. Their frustrations were evident:
To uncover what educators and parents really needed, I led a research phase anchored by 21 in-depth interviews with teachers, counselors, and parents. Their frustrations were evident:
Most existing SEL reports felt removed from real behavior and gave little insight into what was actually happening with students.
Most existing SEL reports felt removed from real behavior and gave little insight into what was actually happening with students.
Most existing SEL reports felt removed from real behavior and gave little insight into what was actually happening with students.
Educators wanted real-time data, easy ways to spot students in need or those excelling, and the ability to intervene promptly.
Educators wanted real-time data, easy ways to spot students in need or those excelling, and the ability to intervene promptly.
Educators wanted real-time data, easy ways to spot students in need or those excelling, and the ability to intervene promptly.
Parents longed for transparent, actionable updates, not just numbers, but a narrative of their child's emotional development
Parents longed for transparent, actionable updates, not just numbers, but a narrative of their child's emotional development
Parents longed for transparent, actionable updates, not just numbers, but a narrative of their child's emotional development


Who we designed for
We created four core personas to ensure the VR dashboard addressed distinct perspectives within the classroom ecosystem. Each persona revealed how diverse users interact with SEL tools and what truly drives engagement.
Emily - The Counsellor
Sandra - The Parent
Maya - The Educator
Arjun - The Student
Competitor Analysis
Competitor Analysis
Competitor Analysis
Mapping The Landscape
Mapping The Landscape
Mapping The Landscape
Before jumping into solution-building, I needed to understand how other SEL tools approached the challenge. I conducted a comprehensive analysis of 99 evidence-based SEL programs from CASEL-aligned curricula to gamified apps popular in middle schools.
This work involved digging into public frameworks, teacher dashboards, survey instruments, and published research. Alongside expert interviews, I conducted deep feature mapping and logged key findings visually for rapid synthesis.

Lack of progress visibility
Lack of progress visibility
Lack of progress
visibility
Most SEL programs focus on curriculum delivery rather than showing real-time emotional growth.
Most SEL programs focus on curriculum delivery rather than showing real-time emotional growth.

Overreliance on surveys
Overreliance on surveys
Overreliance on surveys
Programs depend on quantitative surveys that fail to capture nuanced behavioral data.
Programs depend on quantitative surveys that fail to capture nuanced behavioral data.

No real-time educator
insights
No real-time educator
insights
No real-time
educator insights
Teachers lack immediate visibility into how empathy and SEL skills evolve during gameplay.
Teachers lack immediate visibility into how empathy and SEL skills evolve during gameplay.
Problem Exploration
Problem Exploration
Problem Exploration
Rethinking Current SEL Data
Rethinking Current SEL Data
Rethinking Current SEL Data
Before jumping into solution-building, I needed to understand how other SEL tools approached the challenge. I conducted a comprehensive analysis of 99 evidence-based SEL programs from CASEL-aligned curricula to gamified apps popular in middle schools.
This work involved digging into public frameworks, teacher dashboards, survey instruments, and published research. Alongside expert interviews, I conducted deep feature mapping and logged key findings visually for rapid synthesis.
Solution Overview
The Solution: VR Dashboard, Designed for Real Life
The Solution: VR Dashboard, Designed for Real Life
Main Dashboard
The journey begins with a central dashboard where educators see an at-a-glance view of class SEL scores, average performance, and recent plays, each with red or green highlights for instant status recognition. Widgets flag top performers and at-risk students, while comparative insights (class vs. national averages) show how the class measures up.


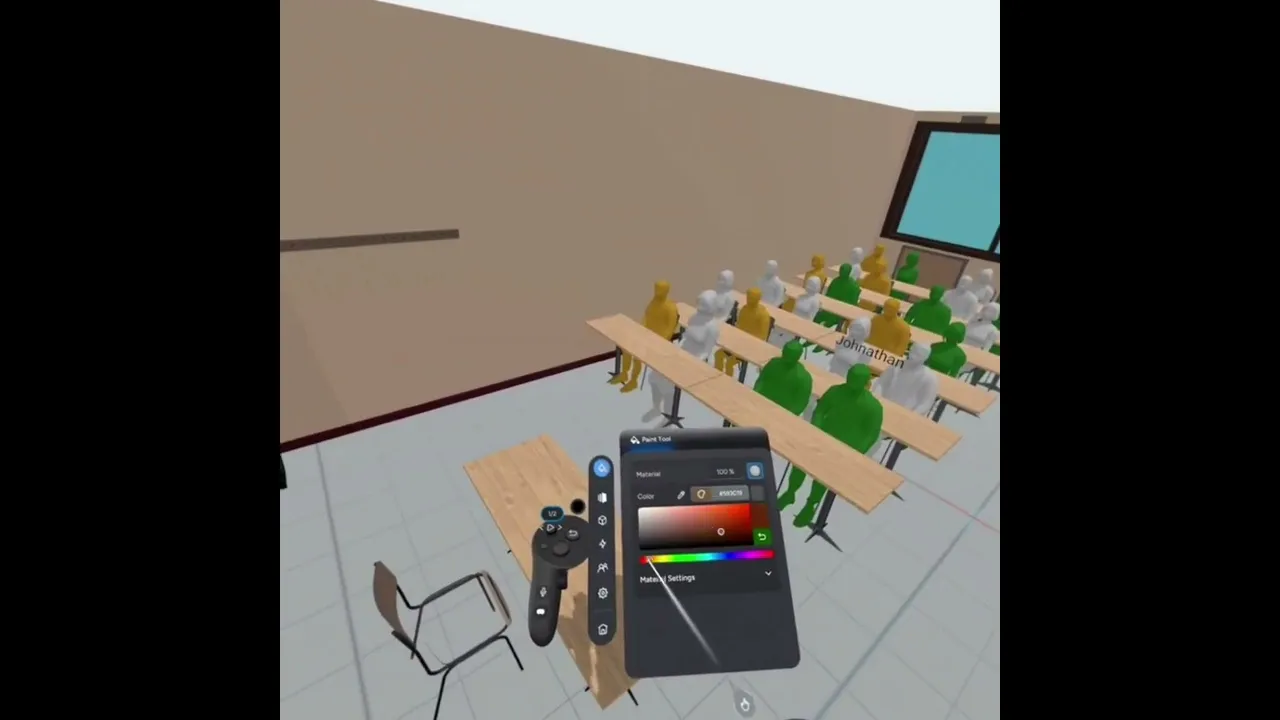
Class View
Clicking “Class View” launches an immersive VR classroom. Here, each student is represented as an avatar, their name above their head, and colored green, orange, or red based on their SEL performance. One glance and patterns emerge, letting teachers tune in to the emotional “mood” of the class.

Making the Abstract Tangible
Teachers can click on any student for detailed stats presented on the virtual blackboard. From empathy growth trends, time spent in key “glasses,” completed memories, to deep bonds and standout moments, this view surfaces what was previously hidden. A graph visualizes 12 months of change, and the next steps are clear: schedule a meeting if scores dip, or instantly email parents to celebrate growth.


Seamless Follow-Through
If a meeting is needed, an intelligent scheduler syncs calendars, suggests times, and fills in context for the teacher, counselor, and parent. For strong performers, an automated but personal update celebrates each student’s progress with options to export reports for school records.


Cross-Device Sync
Cross-Device Sync
Synchronize seamlessly across all VR headset models for versatile classroom use.
Synchronize seamlessly across all VR headset models for versatile classroom use.
Automated Parent Updates
Automated Parent Updates
Send timely email updates to parents of high-performing students, reducing call volume.
Send timely email updates to parents of high-performing students, reducing call volume.
Contextual Meeting Prep
Contextual Meeting Prep
View recent 6-month SEL score trends directly in the meeting scheduler to craft precise emails.
View recent 6-month SEL score trends directly in the meeting scheduler to craft precise emails.
PDF Export
PDF Export
Download full student performance reports as PDFs for easy sharing and documentation.
Download full student performance reports as PDFs for easy sharing and documentation.
Other Interesting Features
User-Friendly Interface
Advanced Analytics
Real-time Collaboration
Task Management
Task Management
Real-Time Insights
Task Management
Security Measures
Performance Tracking
Performance Tracking
Dynamic Reporting
Design and Prototyping
Design and Prototyping
Design and Prototyping
Crafting in VR: From Figma to Final Scene
Crafting in VR: From Figma to Final Scene
Crafting in VR: From Figma to Final Scene
Prototyping in VR
Prototyping in VR
Spatial Design, Not Just Digital
Spatial Design, Not Just Digital
Import & Align
Import & Align
Transform 2D Figma wireframes into interactable 3D elements.
Transform 2D Figma wireframes into interactable 3D elements.
Manual Placement
Manual Placement
Align every panel, widget, and object for optimal clarity in VR space.
Align every panel, widget, and object for optimal clarity in VR space.
Collaboration
Collaboration
Work hands-on with the ShapesXR team to refine workflow and interface.
Work hands-on with the ShapesXR team to refine workflow and interface.
Process Video
Process Video
Showcase scene-building and precise element alignment in real time.
Showcase scene-building and precise element alignment in real time.
Spatial Testing
Spatial Testing
Iterate and user-test in VR to achieve true immersion, beyond flat design.
Iterate and user-test in VR to achieve true immersion, beyond flat design.
Design Insights
Design Insights
Design Insights
The Science Behind the Design
The Science Behind the Design
The Science Behind the Design
Making data human-centered through psychology and interaction

Visual Cognition
Instant Pattern Recognition for Teachers
Color-coded cues (green, orange, red) help educators instantly spot trends and prioritize attention, leveraging human visual processing for fast understanding and triage.
Embodied Engagement
Deep Immersion for Stronger Learning
Interacting with data in 3D space makes insights tangible. Educators experience information physically and emotionally, driving deeper recall and connection to student growth.

Gamified Motivation
Active Participation and Celebrated Progress
Both teachers and students shift from passive observers to active participants. Real-time interaction and gamified achievements make emotional growth engaging and rewarding for everyone.

Visual Cognition
Instant Pattern Recognition for Teachers
Color-coded cues (green, orange, red) help educators instantly spot trends and prioritize attention, leveraging human visual processing for fast understanding and triage.
Embodied Engagement
Deep Immersion for Stronger Learning
Interacting with data in 3D space makes insights tangible. Educators experience information physically and emotionally, driving deeper recall and connection to student growth.
Gamified Motivation
Active Participation and Celebrated Progress
Both teachers and students shift from passive observers to active participants. Real-time interaction and gamified achievements make emotional growth engaging and rewarding for everyone.
Meetings and Collaboration
Seamless Collaboration for Effective Meetings
Easily schedule and manage meetings, collaborate in real-time, and keep everyone aligned for successful team interactions and faster decision-making.

Meetings and Collaboration
Seamless Collaboration for Effective Meetings
Easily schedule and manage meetings, collaborate in real-time, and keep everyone aligned for successful team interactions and faster decision-making.
Events and Document Sharing
Organize Events and Share Documents
Effortlessly manage events, share important documents, and collaborate with your team to ensure everything is in one place and easily accessible.
Events and Document Sharing
Organize Events and Share Documents
Effortlessly manage events, share important documents, and collaborate with your team to ensure everything is in one place and easily accessible.
Planning and Tracking
Efficient Planning and Real-Time Tracking
Plan tasks, set priorities, and track progress with ease to ensure projects stay on track and deadlines are met with minimal effort.
Planning and Tracking
Efficient Planning and Real-Time Tracking
Plan tasks, set priorities, and track progress with ease to ensure projects stay on track and deadlines are met with minimal effort.


Impact and Scalability
Impact and Scalability
Impact and Scalability
Business Impact & Implementation
Business Impact & Implementation
Business Impact & Implementation
Efficiency
Scalability
Market Position
Outcomes
Business Value
Automated Reporting for Educators
40% Reduction in Admin Workload
The dashboard automates progress summaries, freeing time for counselors & teachers to focus on direct student support.
Improved Reporting Accuracy
Automated data aggregation reduces errors, providing reliable insights for effective interventions.
Automated Reporting
Automated Reporting
Automated Reporting
Real-Time Intervention
Real-Time Intervention
Real-Time Intervention
Scalable Architecture
Scalable Architecture
Scalable Architecture
User-Centered Design
User-Centered Design
User-Centered Design


Waved goodbye to
Manual Tracking
Fragmented data
Inaccessible insights
Static feedback
Delayed interventions
Subjective assessments
Task overload
Manual Tracking
Fragmented data
Inaccessible insights
Static feedback
Delayed interventions
Subjective assessments
Task overload
Manual Tracking
Fragmented data
Inaccessible insights
Static feedback
Delayed interventions
Subjective assessments
Task overload
Manual Tracking
Fragmented data
Inaccessible insights
Static feedback
Delayed interventions
Subjective assessments
Task overload
Benchmarking
Benchmarking
Benchmarking
Before & After: What Changed?
Before & After: What Changed?
Before, Educators saw static spreadsheets, delayed surveys, and abstract scores.
Afterwards, they interact inside a VR classroom, viewing real students, instant feedback, and trend graphs, and can act immediately for students in need.
Discover how Prismo outperforms other platforms with superior features, better performance, and unmatched ease of use.
Current SEL Reports
Static spreadsheets and delayed surveys
Static spreadsheets and delayed surveys
Static spreadsheets and delayed surveys
Abstract and hard-to-interpret scores
Abstract and hard-to-interpret scores
Abstract and hard-to-interpret scores
Lacks real-time or contextual feedback
Lacks real-time or contextual feedback
Lacks real-time or contextual feedback
Difficult for educators to act promptly
Difficult for educators to act promptly
Difficult for educators to act promptly
V/S
Our VR Dashboard
Immersive VR classroom experience
Immersive VR classroom experience
Immersive VR classroom experience
Real-time, interactive student data
Real-time, interactive student data
Real-time, interactive student data
Clear trend graphs and visual cues
Clear trend graphs and visual cues
Clear trend graphs and visual cues
Enables swift intervention for at-risk students
Enables swift intervention for at-risk students
Enables swift intervention for at-risk students
Outcomes and Learnings
Outcomes and Learnings
Outcomes and Learnings
Reflection & Key learnings
Reflection & Key learnings
Reflection & Key learnings
Iterative Improvement
Twelve rounds of usability testing with a diverse group, including educators and students, guided continuous refinement. Understanding how children interact with the VR game was essential to determine meaningful metrics. Testing with teachers focused on feasibility and the value of presenting rich data interactively. We incorporated feedback through multiple cycles of testing and re-testing, adapting features to enhance clarity and usability.
User Connection
User Connection
User Connection
Award-Winning Impact
Award-Winning Impact
Award-Winning Impact
Collaborative Learning
Collaborative Learning
Collaborative Learning